Searching for the Hot Breccia Deposit

banner

In this post we'll share more details about ExploreTech's collaboration with Prismo Metals on the Hot Breccia project. Prismo Metals is an exploration company with properties in Mexico and the United States, and Hot Breccia is an exciting target with lots of exploration potential.

The Hot Breccia Project

Hot Breccia is situated squarely within the world-famous Arizona Copper Belt, surrounded by a series of world-class porphyry copper deposits including the Resolution deposit.

Hot Breccia Regional Setting
Figure 1. Regional setting of the Hot Breccia Project, courtesy of Prismo Metals.

What makes this area so fertile for copper is the combination of a thick layer of paleozoic carbonates, a history of magmatic activity providing mineralizing fluids that react with carbonates to create copper mineralization, and enough time to erode such that all of this is sitting within a few kilometers of the surface. Hot Breccia follows this pattern, with a layer of volcanics covering a thick sequence of paleozoic carbonates which are thought to host a large, undiscovered copper porphyry.

Christmas Mine Geology
Figure 2. Schematic cross section at Hot Breccia showing updated interpretation after Barrett (1974). Courtesy of Prismo Metals.

The particular feature of interest on this property is a large, deep ZTEM anomaly. This anomaly manifests as an electrically conductive structure squarely within the paleozoic sediments.

ZTEM Anomaly Footprint
Figure 3. Plan view of Hot Breccia the surface projection (in magenta) of the ‘probability cloud’ representing the best drill target to test the Hot Breccia mineralized system. Green dots are permitted drill sites, yellow dots are historic drill holes. Courtesy of Prismo Metals.

However, the exact shape, size, and location of the anomaly are unclear. ExploreTech was brought in to provide a quantitative characterization of the deposit and assist in planning an effective drilling plan.

Porphyries and Electromagnetic Geophysics

Electromagnetic geophysics, like ZTEM, responds to electrically conductive anomalies inside the Earth. In porphyries, the conductive material could primary copper sulfides, but it could also be indicator minerals like pyrite which can form just outside the primary mineralization. Either way, the electrical conductors can highlight geological structures that are important for understanding a porphyry system.

ZTEM is a specific type of electromagnetic geophysics that is developed and offered by Geotech. Typically, ZTEM data are interpreted by performing an "inversion", where the electrical signals measured by the ZTEM sensors are transformed into a 3D map of electrical conductivity.

ZTEM Anomaly in 3D
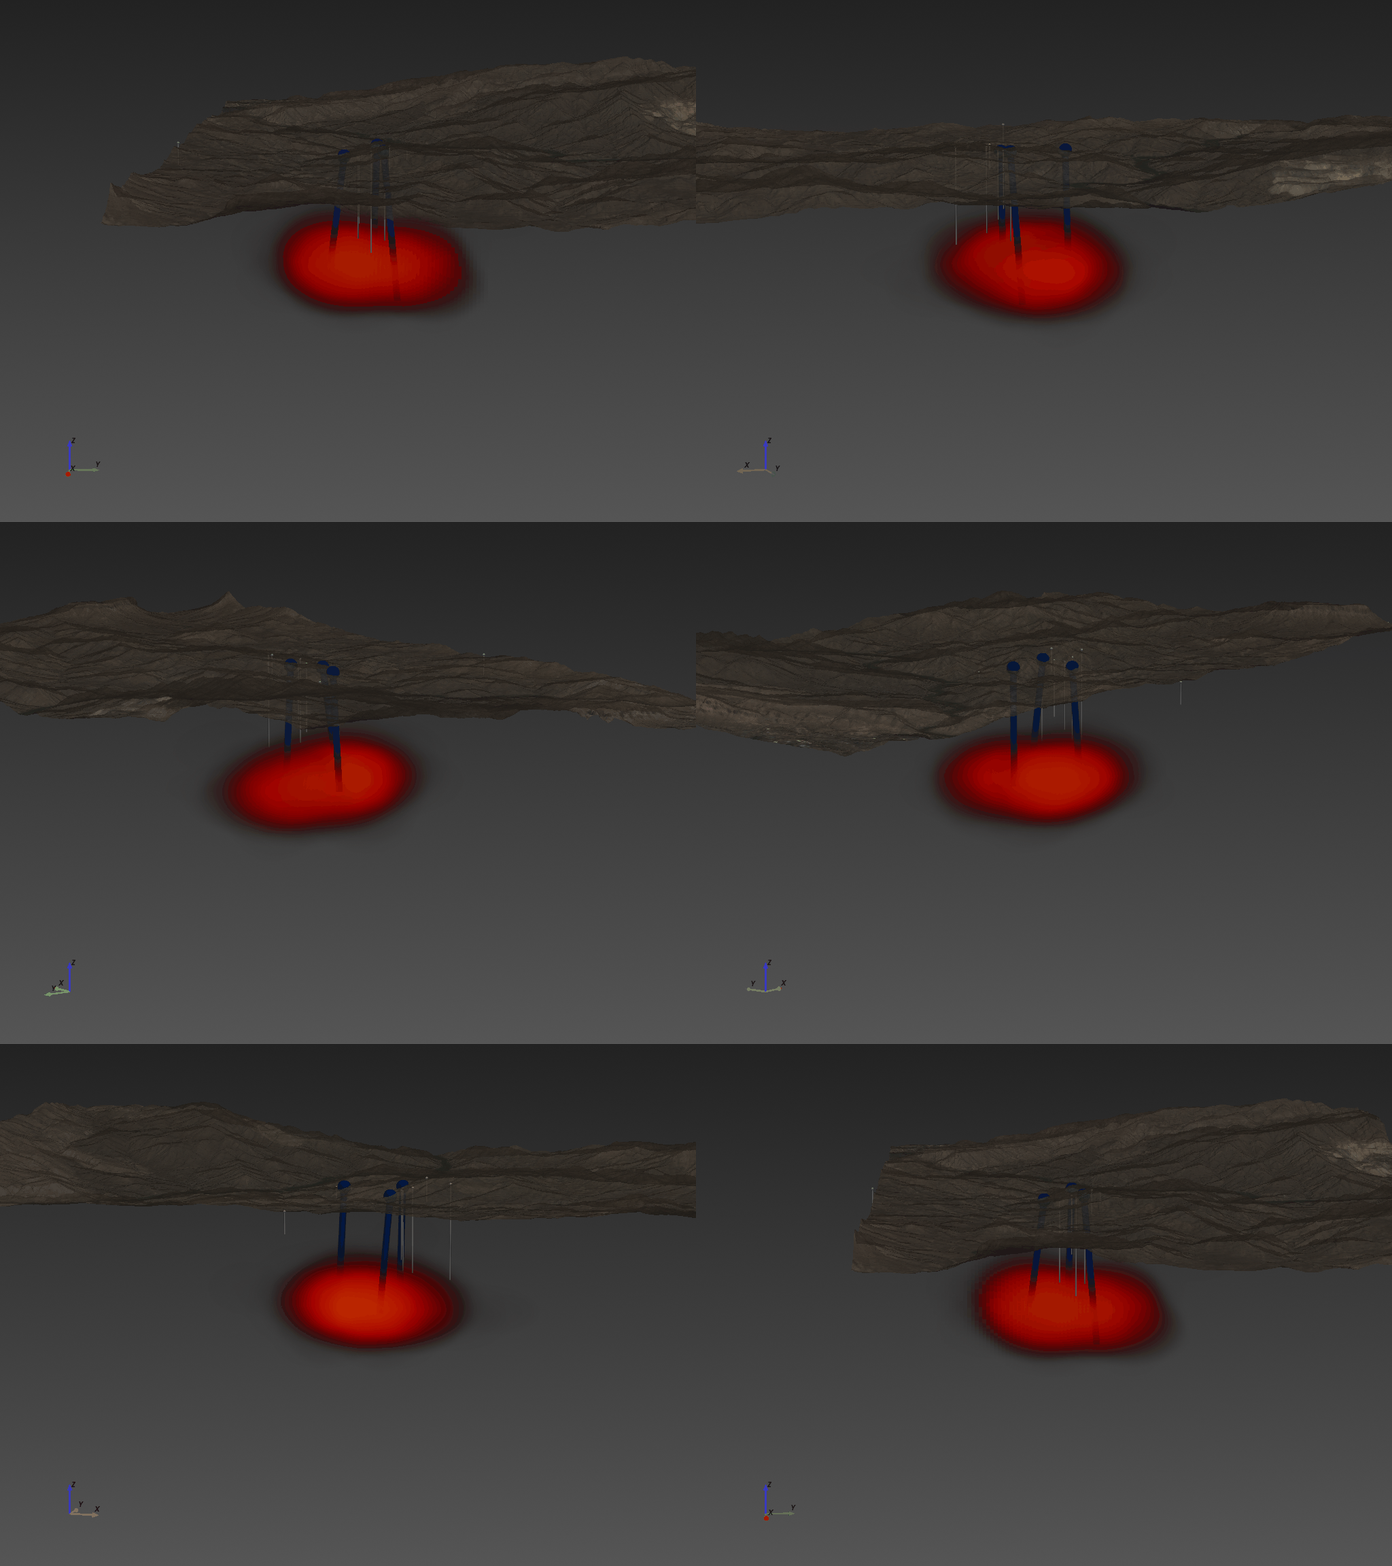
Figure 4. Schematic view of Hot Breccia from underneath the surface showing cross sections through the Christmas deposit and Hot Breccia, and conductive anomaly from ZTEM survey under geology similar to the Resolution deposit. Courtsey of Prismo Metals.

Although visually compelling, these 3D maps tend to give the false impression that they represent the true composition of the subsurface. In reality, many different 3D models could be created by tweaking the inversion parameters, and all of these models would be equally valid. This problem is called "non-uniqueness" because many different 3D maps can all equally explain the observed ZTEM data. Non-uniqueness make drill planning hard, because if drill results come back empty you don't know if it's because the geophysics isn't reliable or if you just need to step out 100 meters and try again.

ExploreTech's Inverter technology solves these problems by going beyond 3D conductivity inversions. Explorers can use Inverter to get quantitative, risk-adjusted insights into their drilling by (a) mapping ZTEM directly to geology, and (b) quantifying non-uniqueness in the geophysics.

Imaging the ZTEM Anomaly

We start by defining the area of interest. The ZTEM survey covers a large area, but the anomaly of interest only covers a small part.

Area of Interest
Figure 5. Satellite view of the Hot Breccia property and the ZTEM anomaly footprint. Modified from images provided by Prismo Metals.

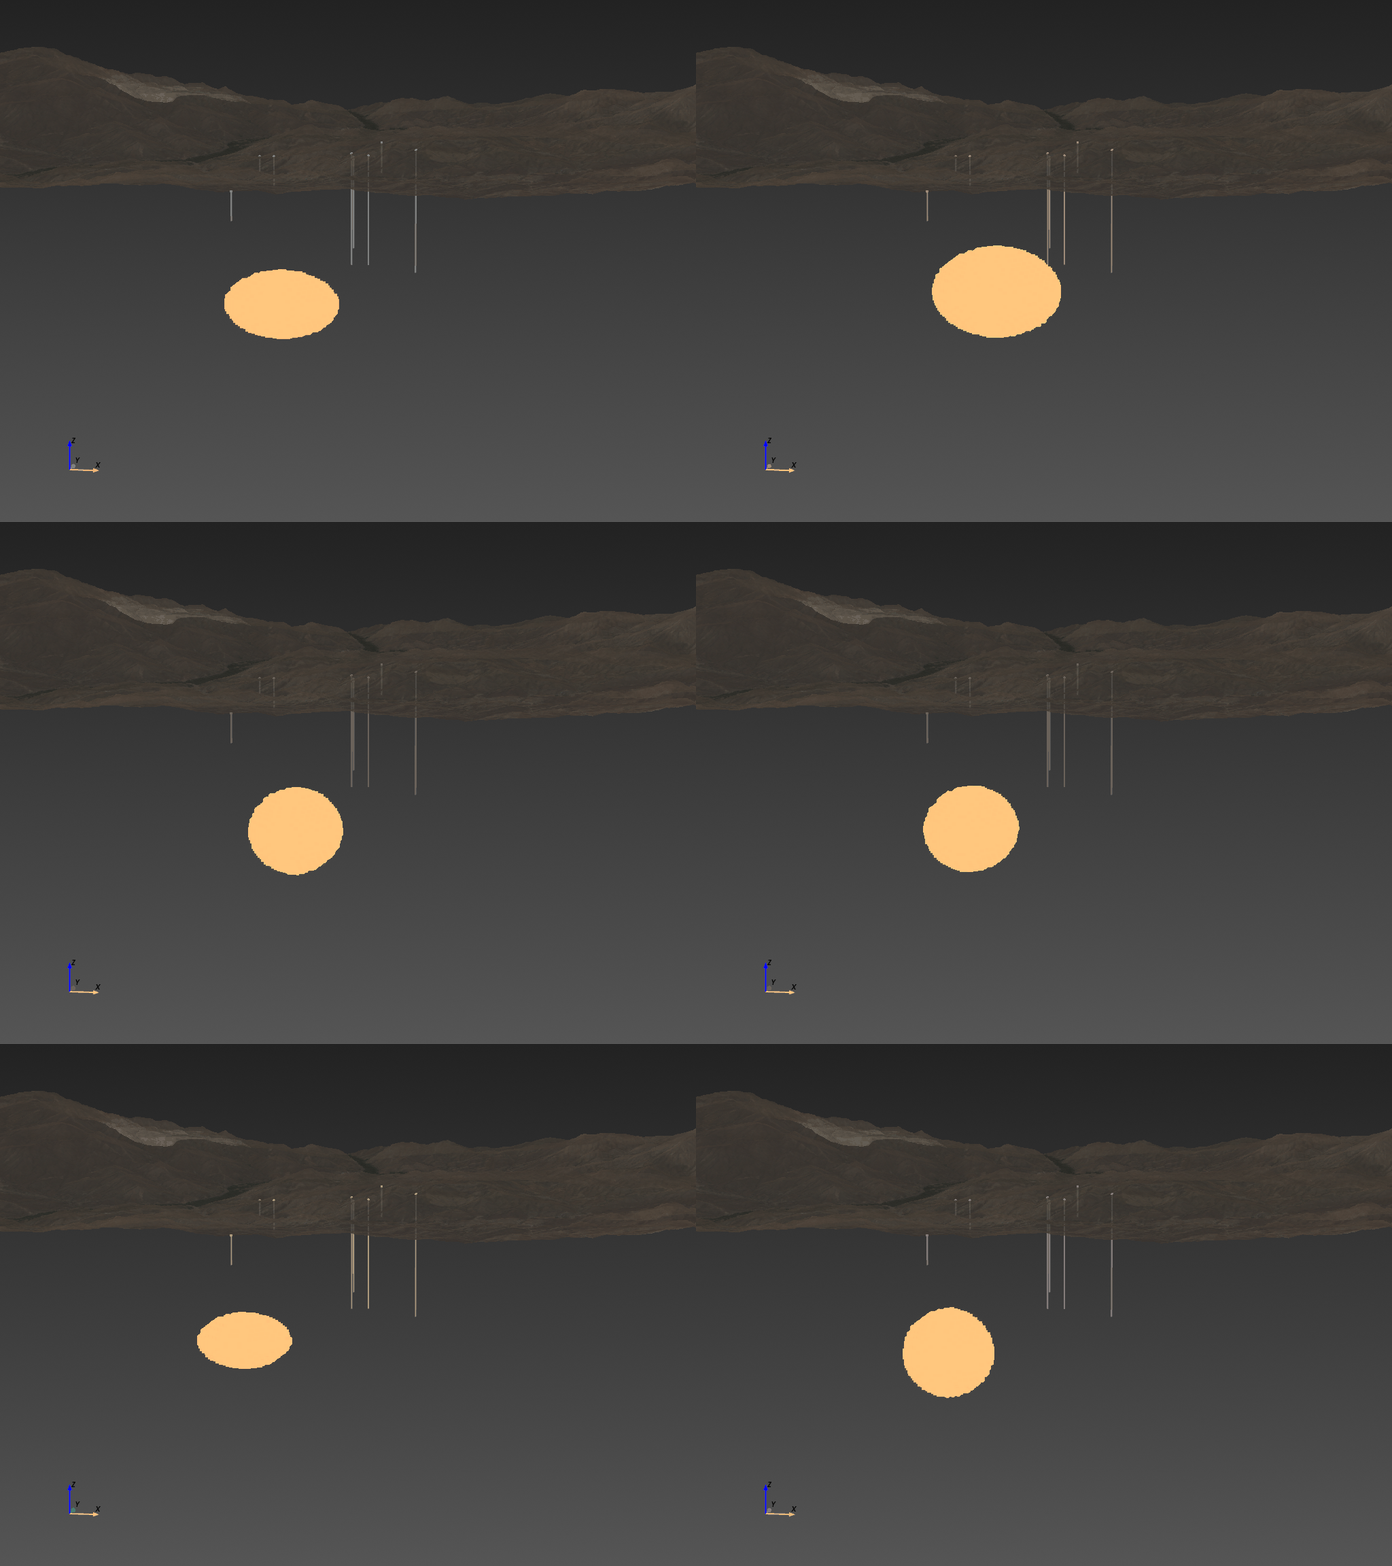
Next we construct the geological model. In this area, there is a layer of volcanics covering a thick sequence of paleozoic sediments. The ZTEM anomaly appears to be located within the paleozoic sediments. We represent the volcanics as a layer, the anomaly as an ellipsoid, and the sediments as the background material. After assigning bounds to the location, shape, size, and physical properties of each model component, we can visualize this initial guess by bouncing through all the possible models.

Prior
Figure 6. Animation of the initial guess for the shape, size, and location of the source of the ZTEM anomaly. The ellipsoid represents an electrically conductive geobody below the surface.

Next we constrain the model to the ZTEM data. We do this by running thousands of forward ZTEM simulations and gradually refining the model. The animation below shows the model parameters (left) and simulated ZTEM (right) being iteratively improved. Overall, this process takes about a week of letting the computers run on the ExploreTech Engine platform. At the end of the process, we refine the models to something like this.

Posterior
Figure 7. Ensemble of matching models (semi-transparent gray ellipsoids, background) with the ZTEM anomaly footprint from the conductivity inversion (semi-transparent, foreground).

We now have a concrete, quantitative understanding of where the source of this anomaly could be. But this is only half the picture - we now need to take action.

Optimizing a Drilling Strategy

Because of environmental regulations, there are 8 drill pads available at Hot Breccia and a drilling budget of 5000m. The drillhole locations are shown below. So where should we drill to find this anomaly?

Permitted Drillholes
Figure 8. Permitted drillholes (lettered gray dots) and roads (black lines) on the Hot Breccia property.

Well, we can solve this by solving an optimization problem. In this case, we find the drilling plan that optimizes the probability of intersecting the conductive anomaly. That simulation takes a couple hours on The Engine, and the optimized plan is shown below.

Permitted Drillholes
Figure 9. Optimized drill collars (lettered drillholes) and drill angles (white arrows).

You can see here how the best strategy would be pick drillholes B, I, and K, and then drill out and away from the drillholes. The reasoning here is that the conductive body could be anywhere within this region, and drilling away gives us the most coverage of the possibilities.

There's lots of other scenarios we can (and have) tested here which are beyond the scope of this post. However, here's a flavor of the other questions that can be answered with Driller:

  • What if we could only drill to 750 meters? 1000 meters? 1500?
  • What is the best drillhole first?
  • What combination of three drillholes performs best?
  • If we could permit somewhere new, where would be the best place to permit?

Overall, we hope this example illuminates the power of probabilistic inversions and drilling optimization.

Concluding Thoughts

<<<<<<< Updated upstream

The anomaly has not yet been drill-tested, but this case study shows how probabilistic geophysical inversions and drilling optimization can provide quantitative insights into early-stage exploration drilling.

Prismo has planned their 2025 drilling campaign

Stashed changes